
The Dutch Ground Motion Service
The Dutch Delta, at the confluence of the Rhine, Meuse, and Scheldt rivers, shaped the Netherlands. However, the area is perhaps even more dynamic due to the activities of its inhabitants: by pumping water from polders, reclaiming land from the sea, and mining various geo-resources (hydrocarbons and salt).
But it is not only the land that is dynamic. The build environment (roads, railways, dikes, bridges and buildings) upon it is dynamic as well. Some of the infrastructure is old, at the end of its lifetime, and needs to be replaced. But where to start?
Geodesy
For the safety of the Netherlands it is therefore of importance to measure and monitor the motion of the land as well as objects on it. This is the field of geodesy. Using terrestrial techniques, this is only possible to a limited extent. But from space, it is possible, with millimeter level precision. Radar satellites emit signals that reflect on the earth surface. These reflections are being used using interferometric synthetic aperture radar (InSAR) technology to estimate the motion of the earth and objects on it. GNSS and gravity data are being used to anchor the estimates to a geodetic datum.
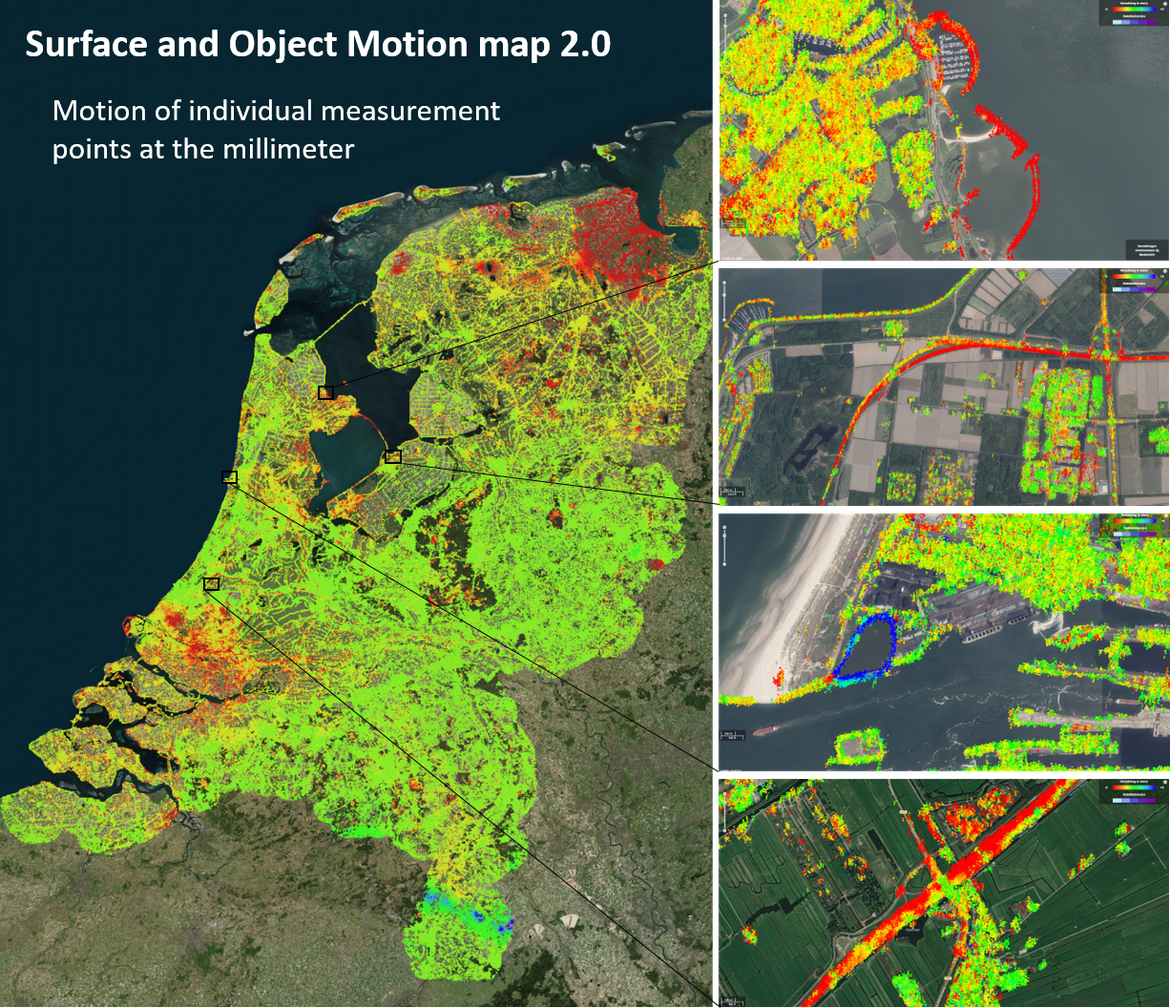
What does the Dutch Ground Motion Service show?
The Dutch Ground Motion Service currently shows two different types of products.
Surface motion map 1.0 utilizes billions of individual measurement points (scatterers) over the Netherlands, and uses statistics to compute the vertical motion of 4 x 4 km cells. This yields a thorough overview of the entire country, and enables us to disentangle the deep and the shallow mechanisms driving the surface motion.
The surface and object motion (SOM) map 2.0 is not only an update of surface motion map 1.0, but is an upgrade as well. Here we show each selected radar measurement location. The SOM viewer shows the motion velocity of 200 million measurement points, using a color map, first in 300 x 300 meter average squares, and subsequently by zooming in further the individual measurement points. The color scale can be adjusted to identify more detail. By clicking on a measurement point, the time series of the displacement of that point is shown.
Who made the Dutch Ground Motion Service?
The Dutch Ground Motion Service is an initiative of the Netherlands Centre for Geodesy and Geo-Informatics (NCG), in collaboration with universities (TU Delft, UTwente, HU), knowledge centres (KNMI), and geodetic companies (SkyGeo, 06-GPS). The estimation of motion parameters from the radar data and the visualization portal is performed by SkyGeo.
By clicking on one of the two buttons below, the interactive Dutch Ground Motion Service environment will start.